Current X-Ray --
24h Peak --
Protons --
Regions --
GOES X-Ray Flux
Flare Markers
Current Flux
--
6-Hour Peak
--
Today's Peak
--
24-Hour Peak
--
GOES SUVI 131Å (Solar Flares)
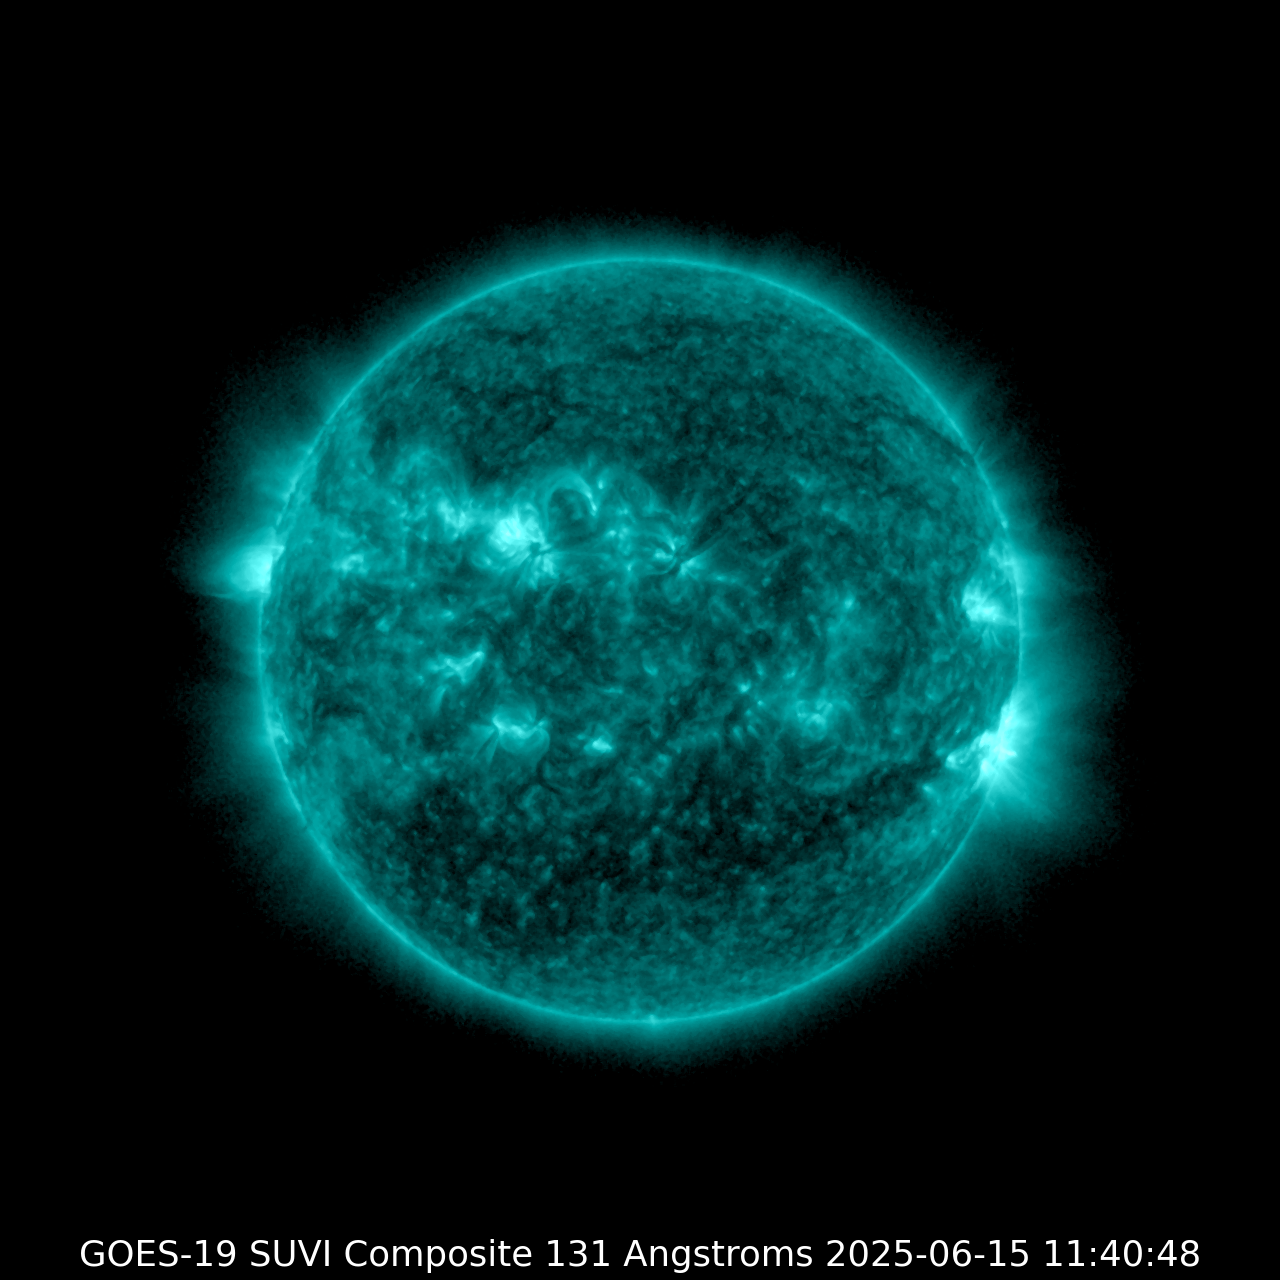
GOES SUVI 131Å
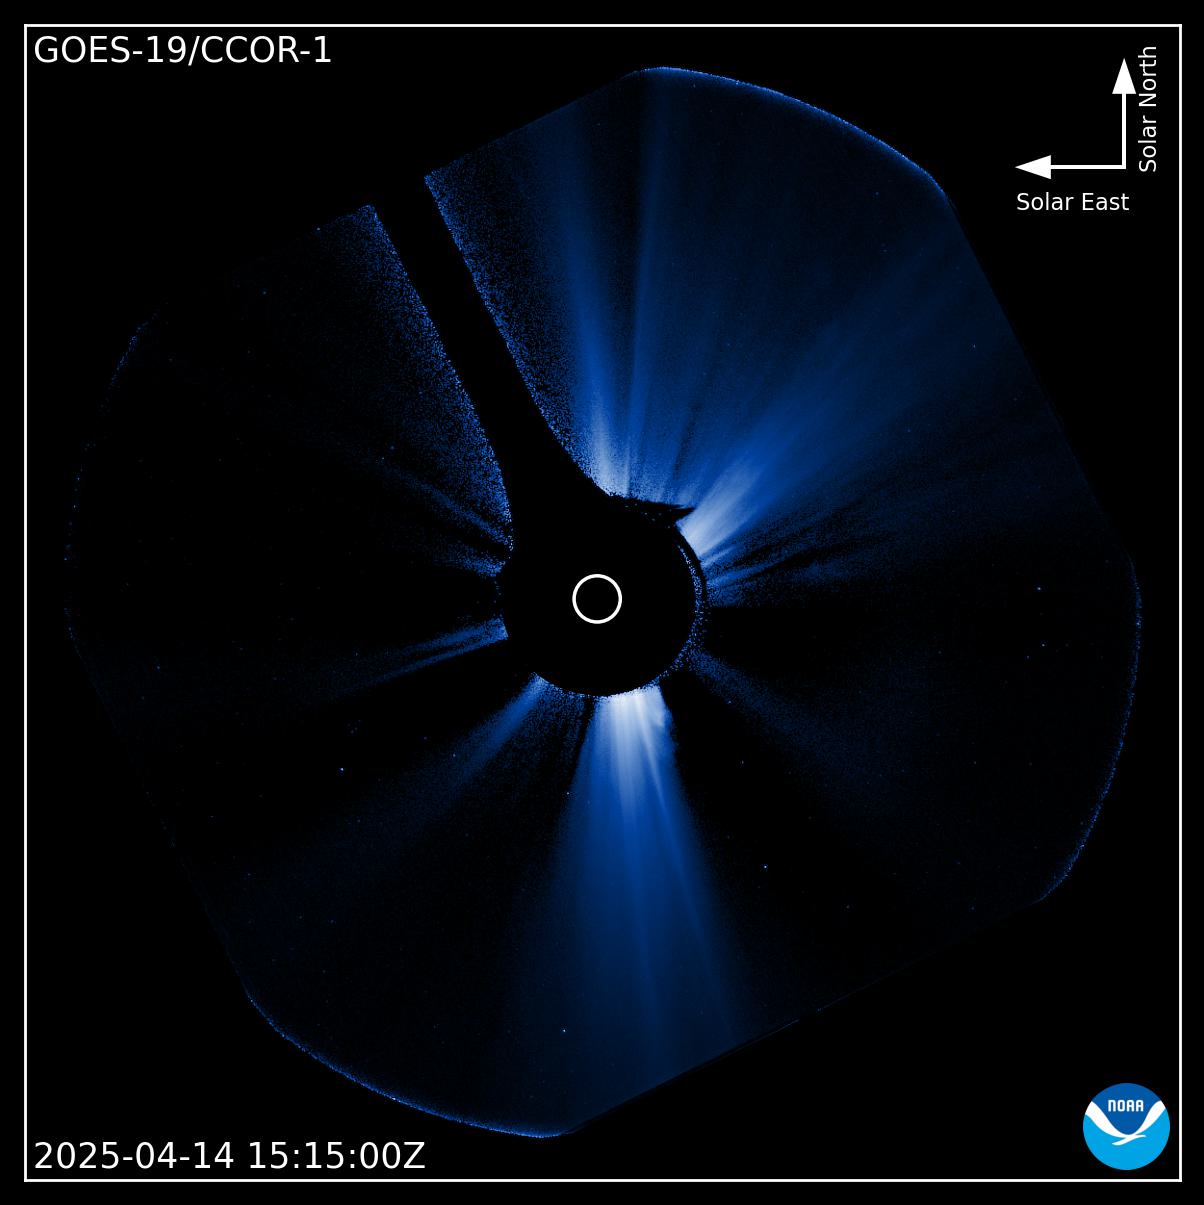
GOES-19 CCOR-1 Coronagraph
GOES-19 CCOR-1
GOES Proton Flux
No Storm
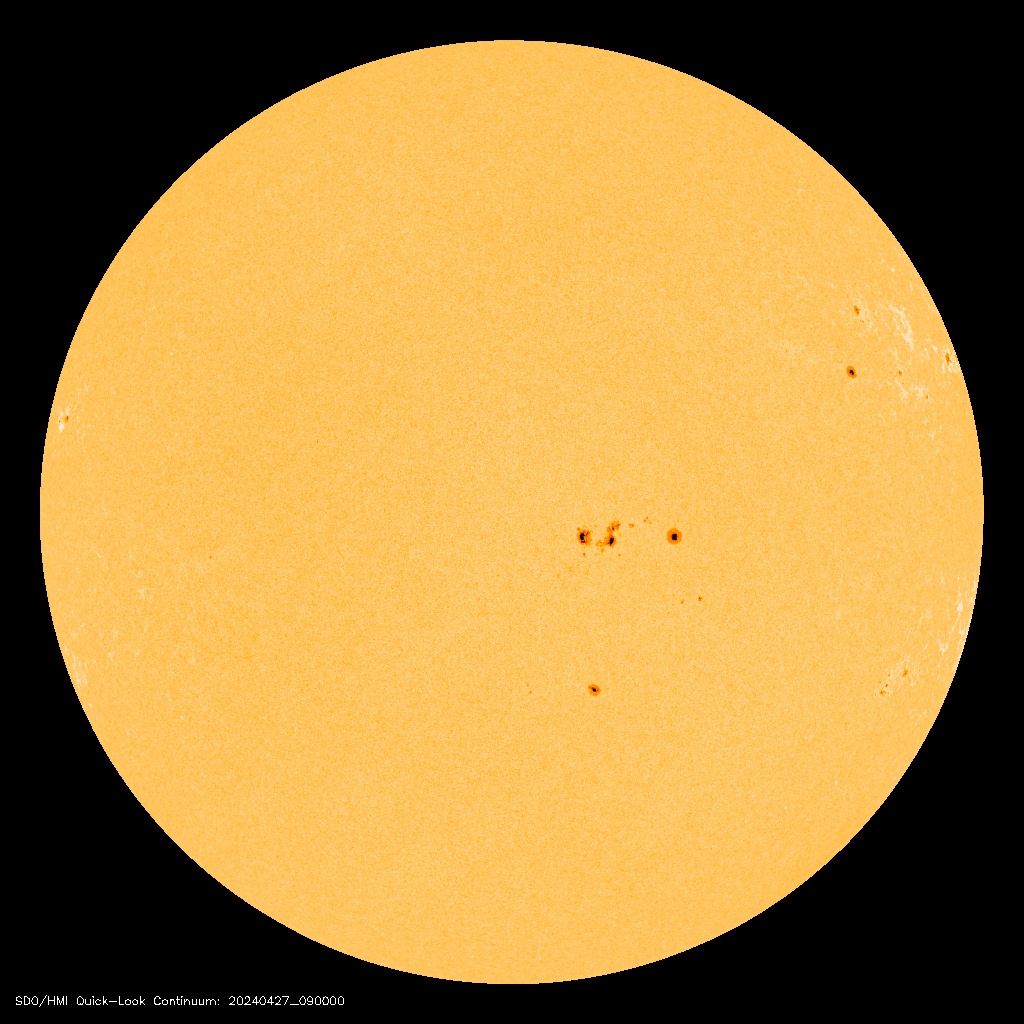
Sunspots
SDO HMI Intensitygram (SOHO NASCOM)
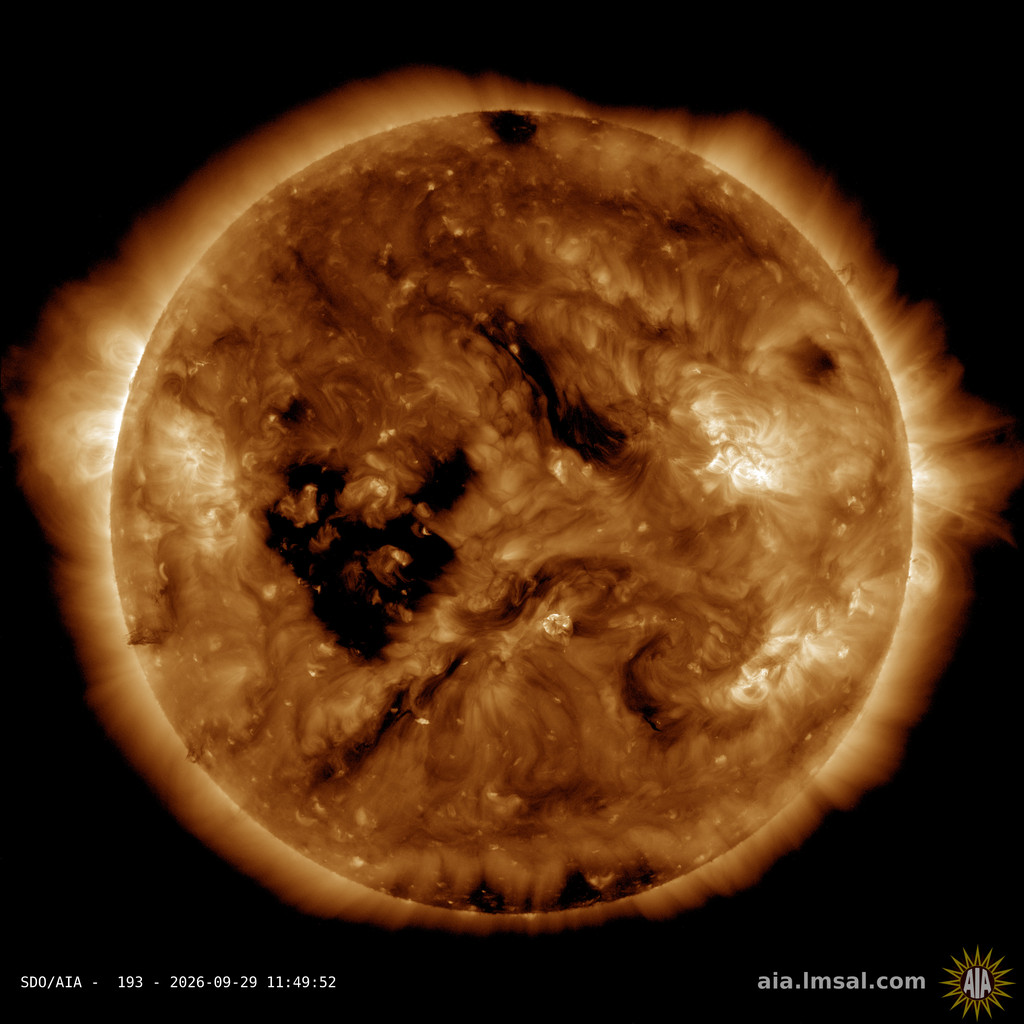
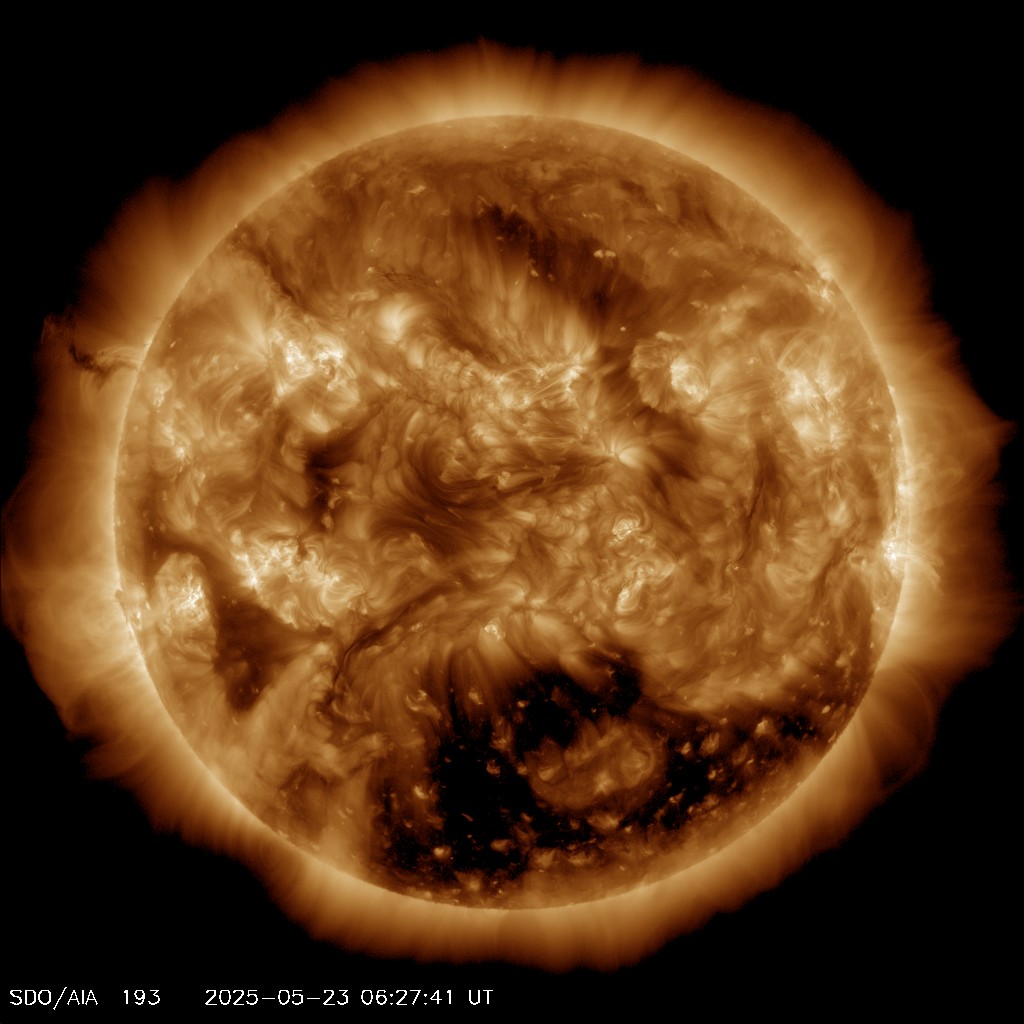
Coronal Holes
SDO AIA 193 Coronal Holes
Solar Indices
Daily Sunspot Number -- Latest SWPC daily report
Smoothed SSN -- Latest centered 13-month value
F10.7 Radio Flux -- 10.7 cm flux units
Solar Rotation
Carrington Rotation --
Active Regions -- SWPC region summary
Latest SWPC Texts
Official SWPC text products, opened in-app for quick review.
Active Solar Regions
Region Location Class Mag Type Area
Loading...
Regions To Return
Region Est. Return
No regions expected
Magnetic Classification:
αAlpha - Unipolar, generally not complex βBeta - Slightly complex βγBeta-Gamma - Complex βγδBeta-Gamma-Delta - Very complex
Area Size (millionths):
●< >200 - Small ●200-600 - Medium ●600-900 - Large ●900-1200 - Very Large ●> 1200 - Extreme
Click any region for detailed info
Recent Solar Flares Solar flares from the past 7 days. C-class are minor, M-class can cause brief radio blackouts, X-class are the most intense.
Filter:

Loading solar flare data...

NOAA Space Weather Scales R=Radio Blackouts (flares), S=Solar Radiation Storms (protons), G=Geomagnetic Storms (Kp)

R - Radio Blackouts

Current
R0

S - Radiation Storms

Current
S0

G - Geomagnetic Storms

Current
G0
Planetary K-index History & Forecast Shows past 48 hours of observed K-index values plus 72-hour forecast. Green bars = historical data, colored bars with patterns = predictions.
QUIET
CME Tracker - Earth-Directed Events Coronal Mass Ejections (CMEs) are large clouds of solar plasma. When they reach Earth, they can cause geomagnetic storms and auroras.

Loading CME data...

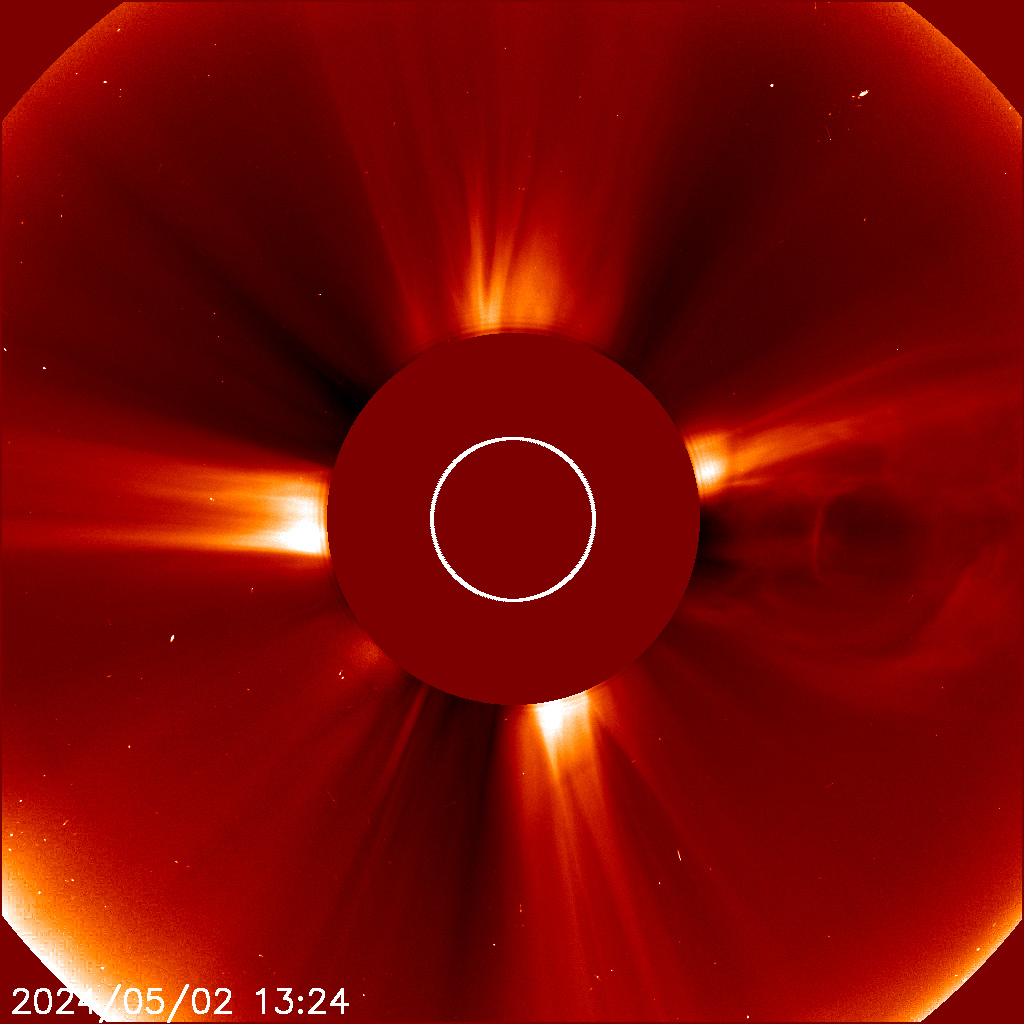
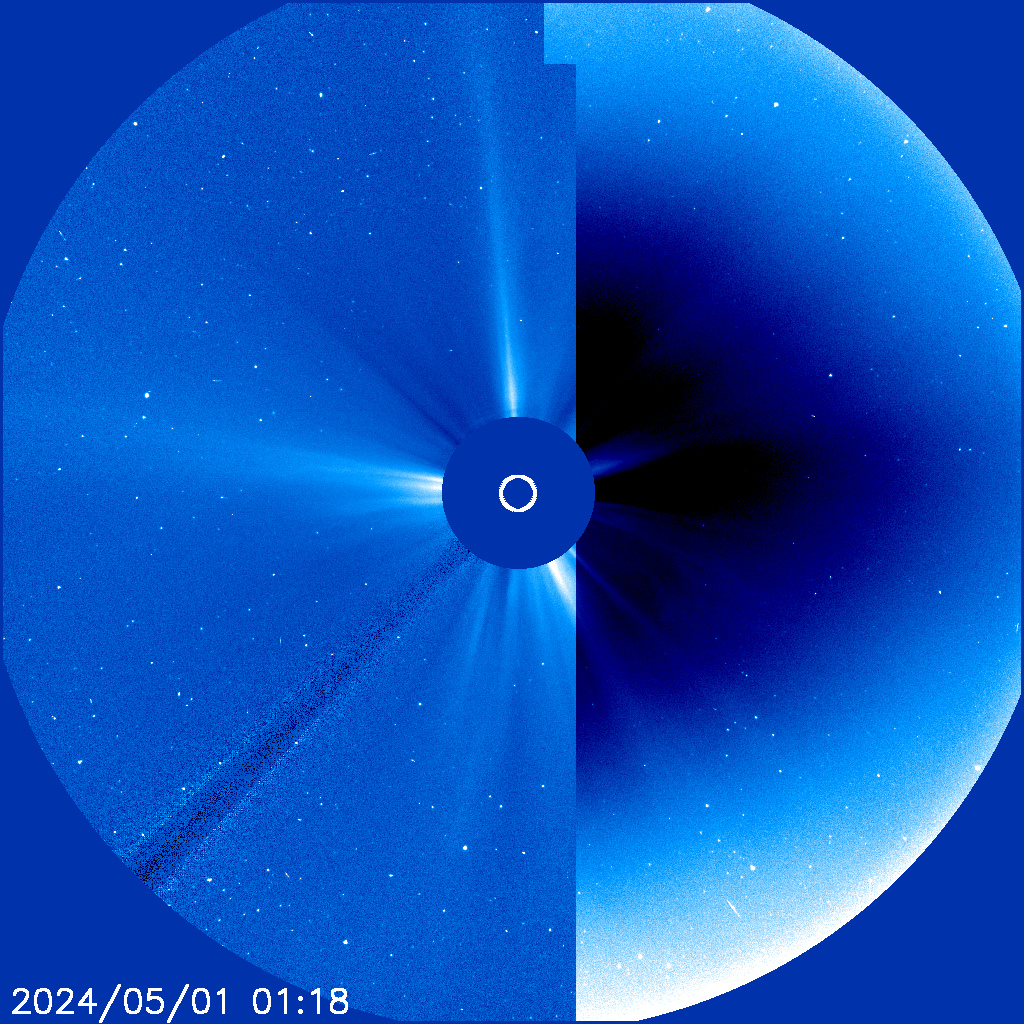
SOHO LASCO C2 Inner coronagraph (2-6 solar radii) - best for detecting CMEs near the sun.
LASCO C2
SOHO LASCO C3 Outer coronagraph (4-30 solar radii) - tracks CMEs as they travel toward Earth.
LASCO C3
WSA-ENLIL Solar Wind Forecast 3-day prediction model showing solar wind density and CME propagation from the Sun to Earth.
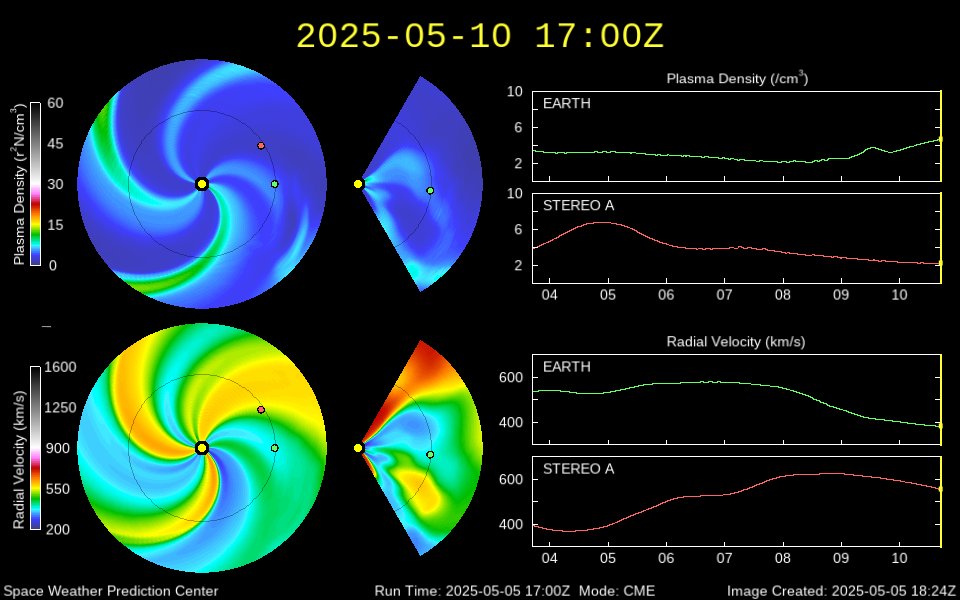
WSA-ENLIL Solar Wind Prediction
D-Region Absorption (Radio Blackout) Predictions Predictions for high-frequency radio absorption caused by solar flares affecting communications.
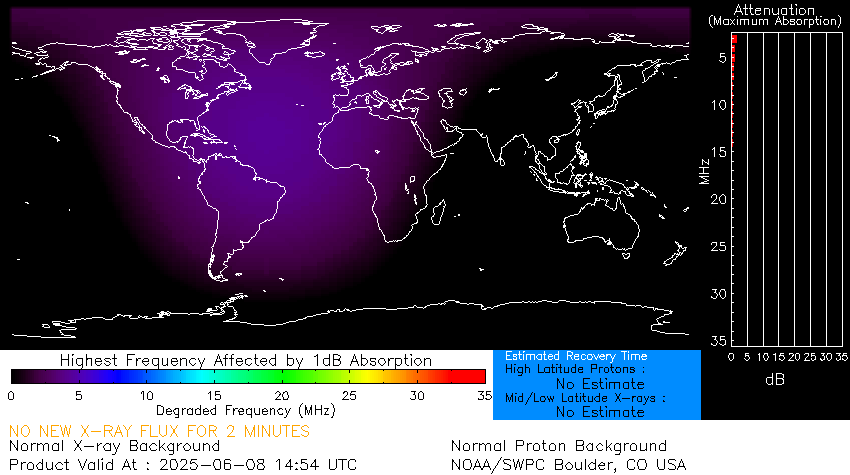
D-RAP Model
Solar Cycle 25
Loading the latest NOAA observed solar-cycle trend.
Monthly Sunspot Number
--
Latest observed month
Smoothed Cycle Signal
--
6-month trend loading...
F10.7 Radio Flux
--
Latest monthly NOAA value
Cycle Phase
--
Cycle state loading...
Cycle Trend Observed monthly and smoothed sunspot numbers from NOAA, with the official NOAA forecast shown for context.
This view stays focused on the measured cycle trend and the official forecast reference.

Featured Views

Multi-Wavelength Composite Combined AIA 211Å, 193Å, 171Å showing different atmospheric layers in one image.
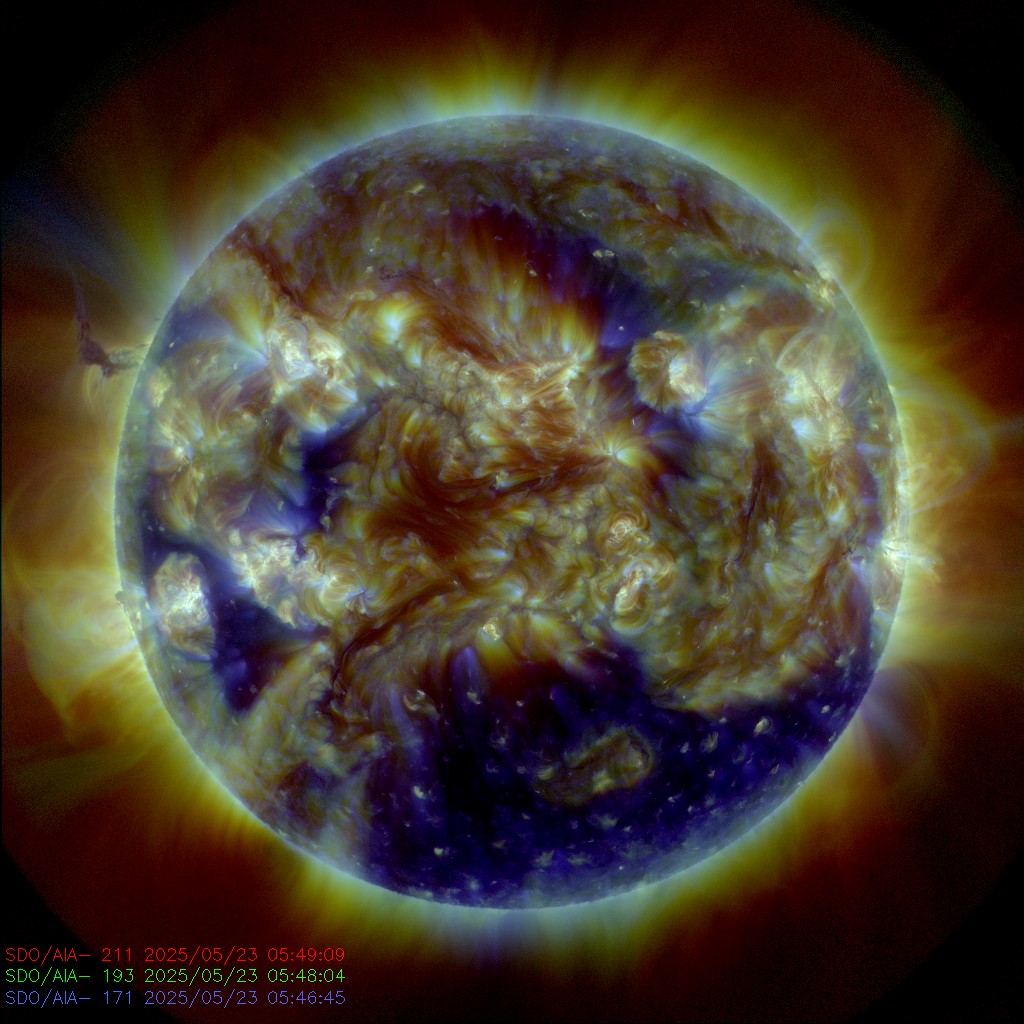
SDO Composite
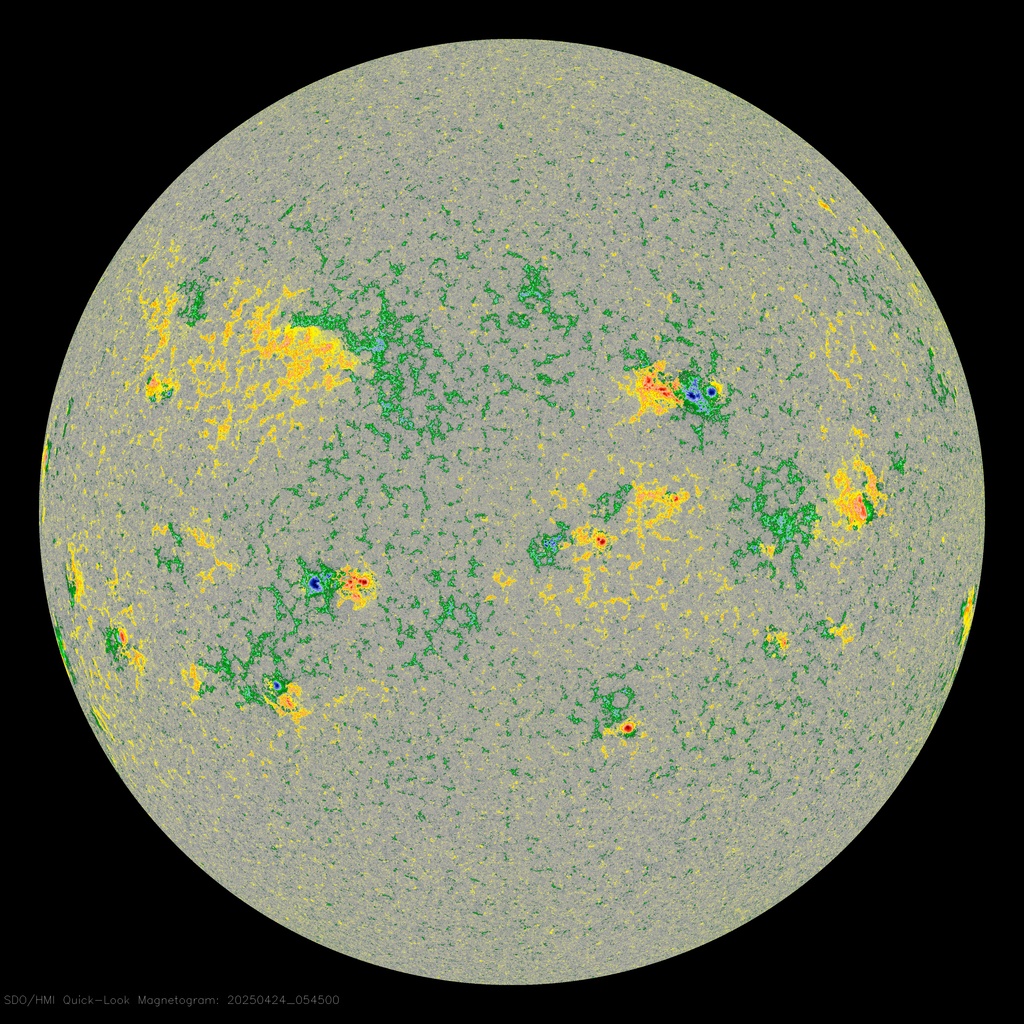
HMI Magnetogram Magnetic field polarity: white/red = positive, black/blue = negative.
HMI Magnetogram
Visible Light (Sunspots) Photosphere in visible light showing sunspots as dark regions.
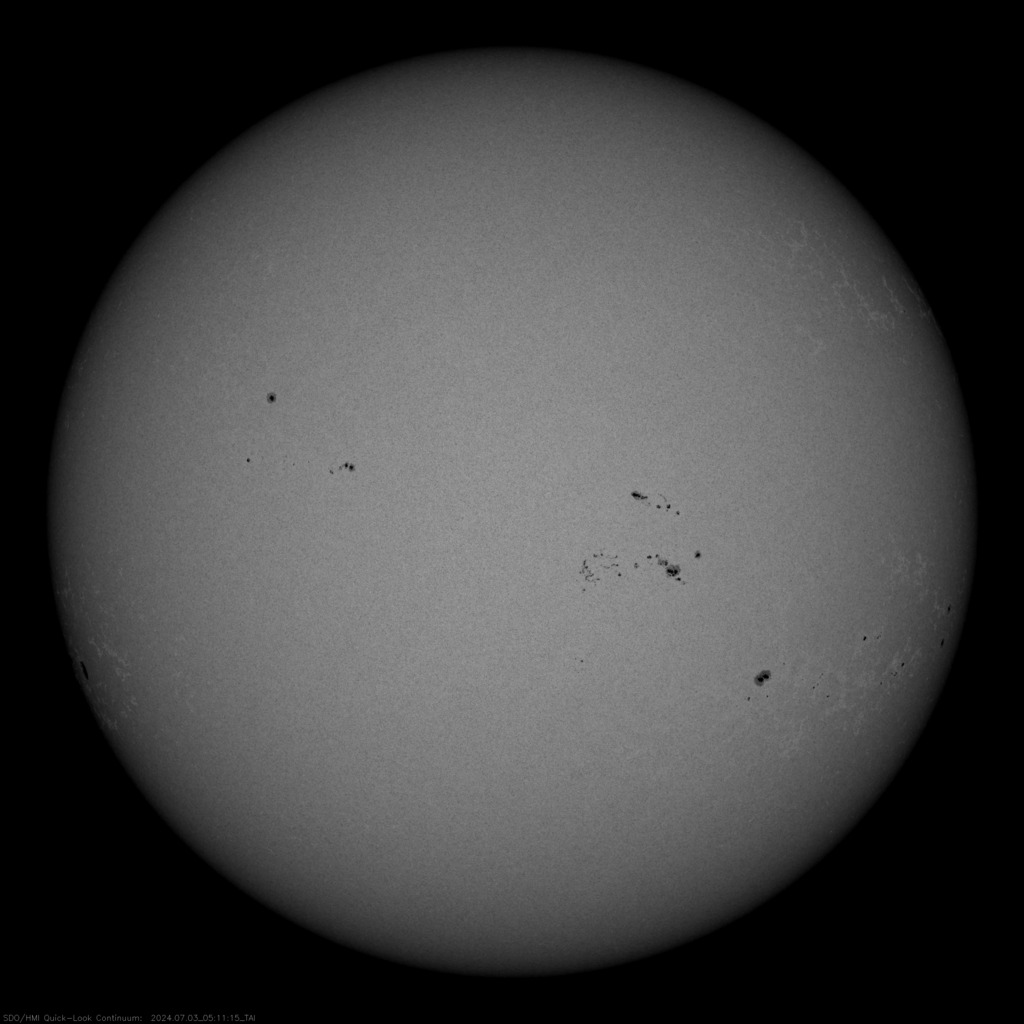
HMI Continuum

SDO AIA Extreme UV

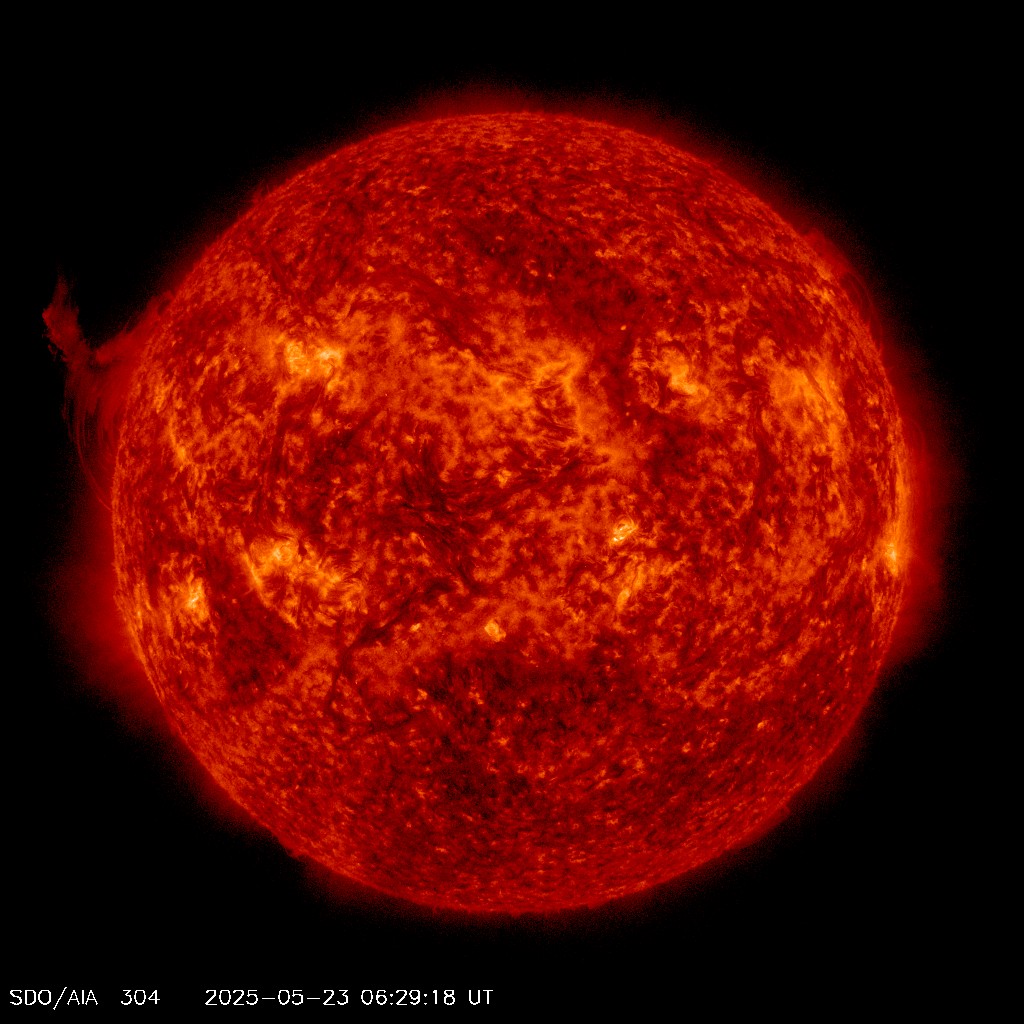
304Å ~60,000K
AIA 304Å
Chromosphere & prominences
171Å ~600,000K
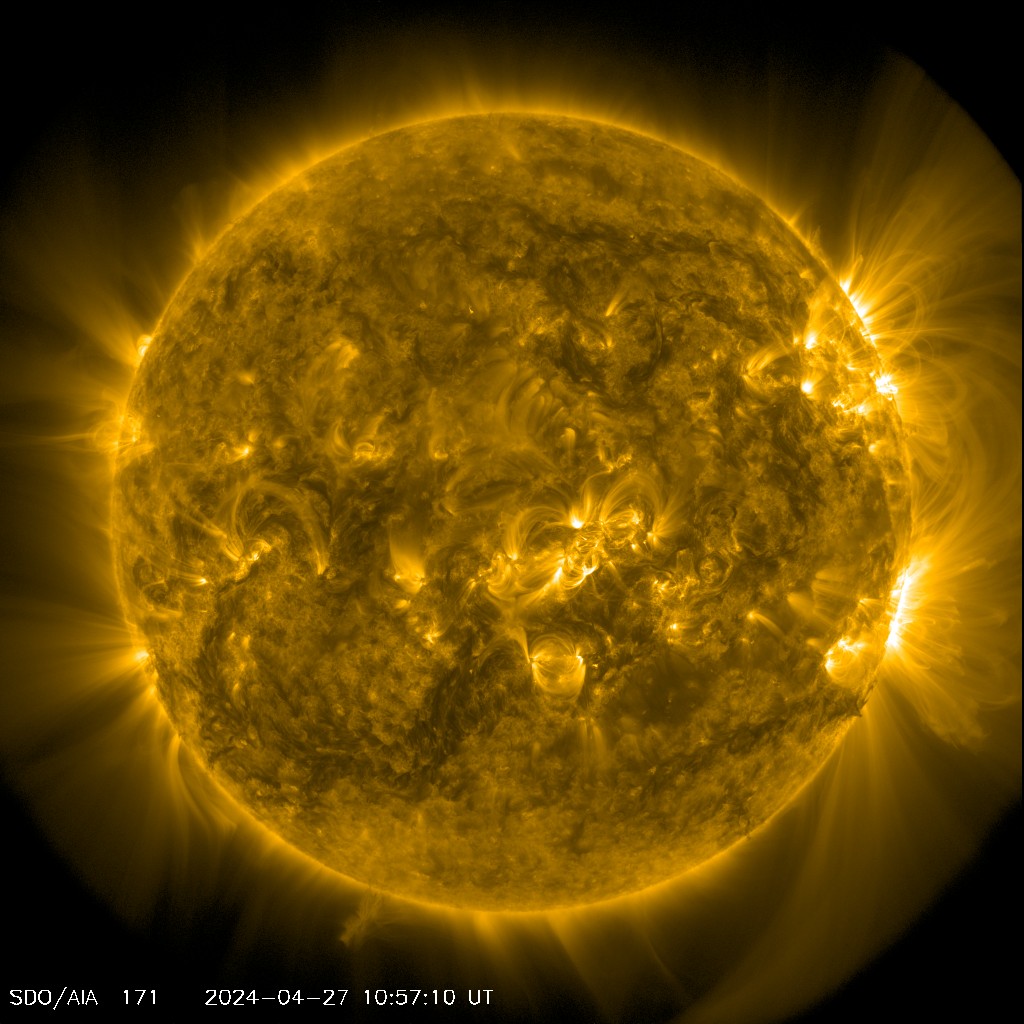
AIA 171Å
Quiet corona & loops
193Å ~1MK
AIA 193Å
Corona & coronal holes
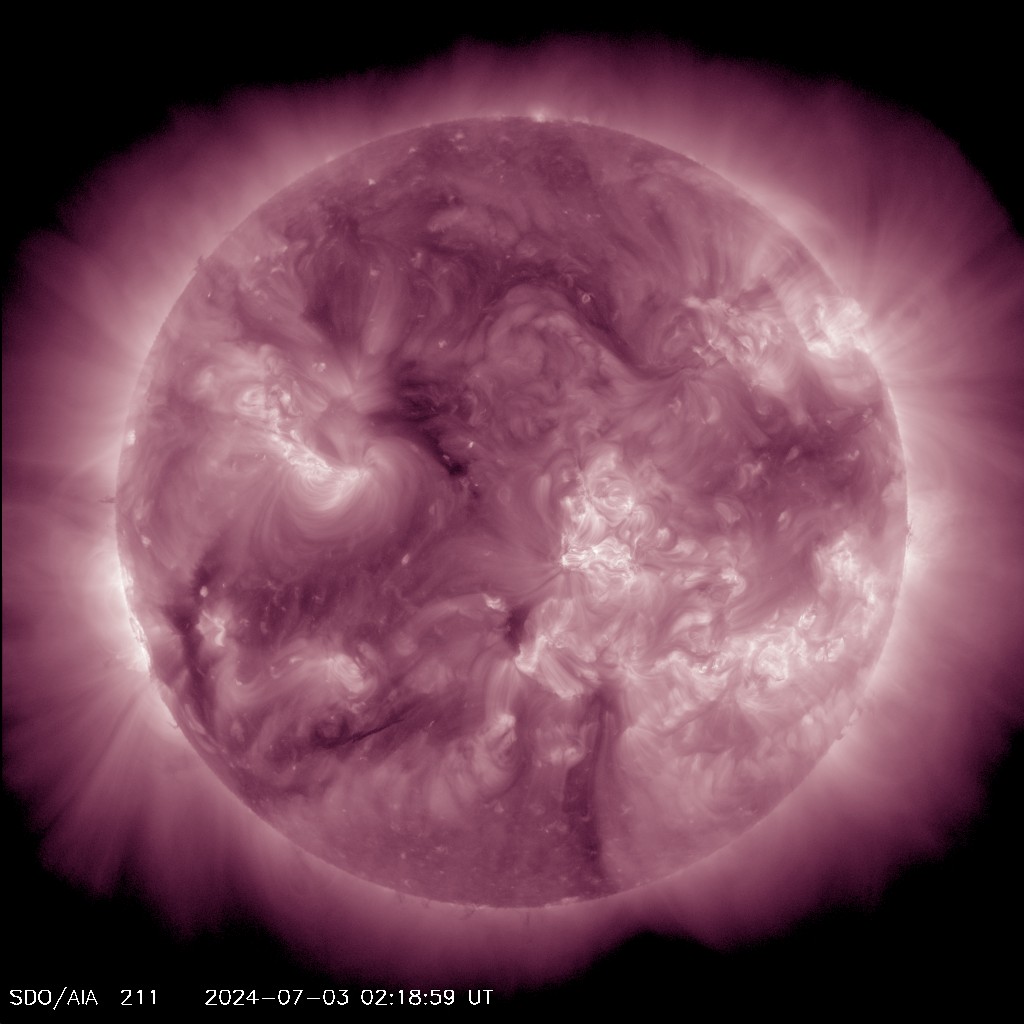
211Å ~2MK
AIA 211Å
Active regions
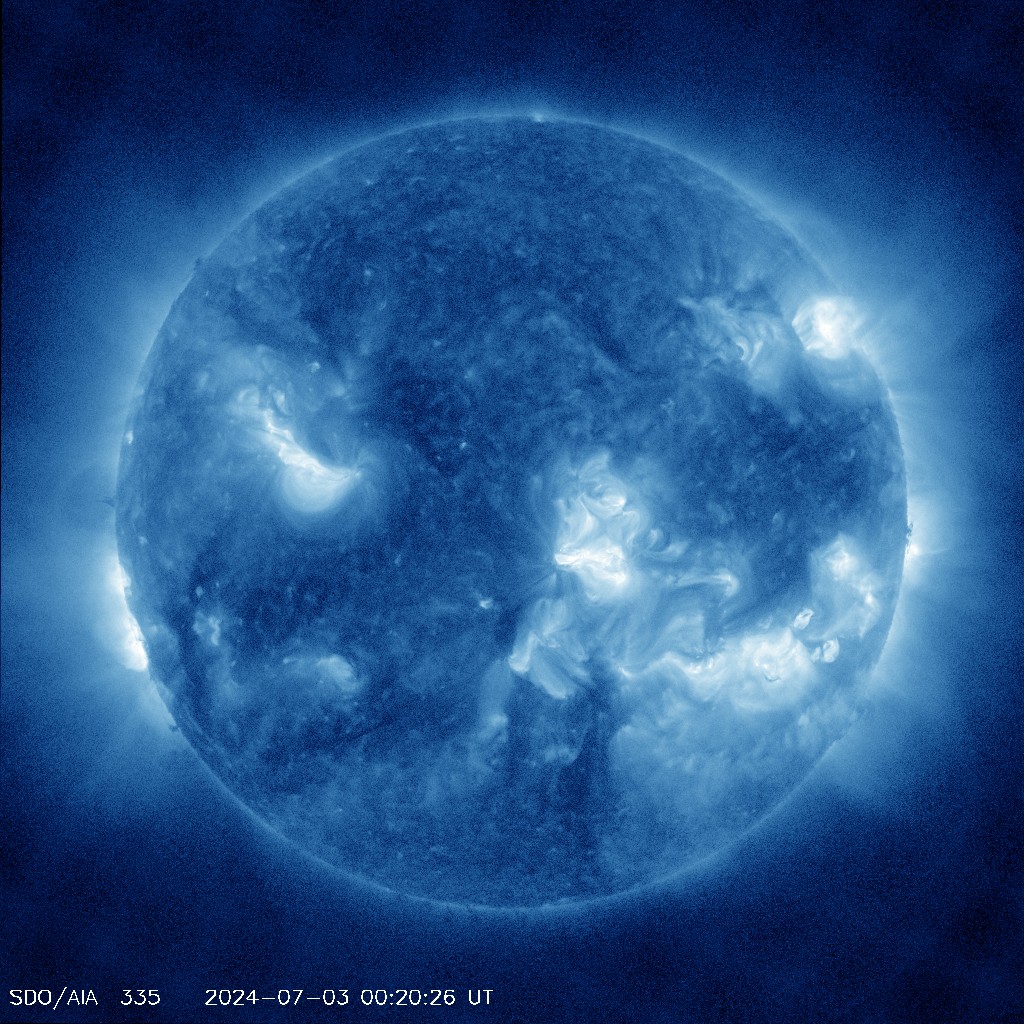
335Å ~2.5MK
AIA 335Å
Very hot plasma
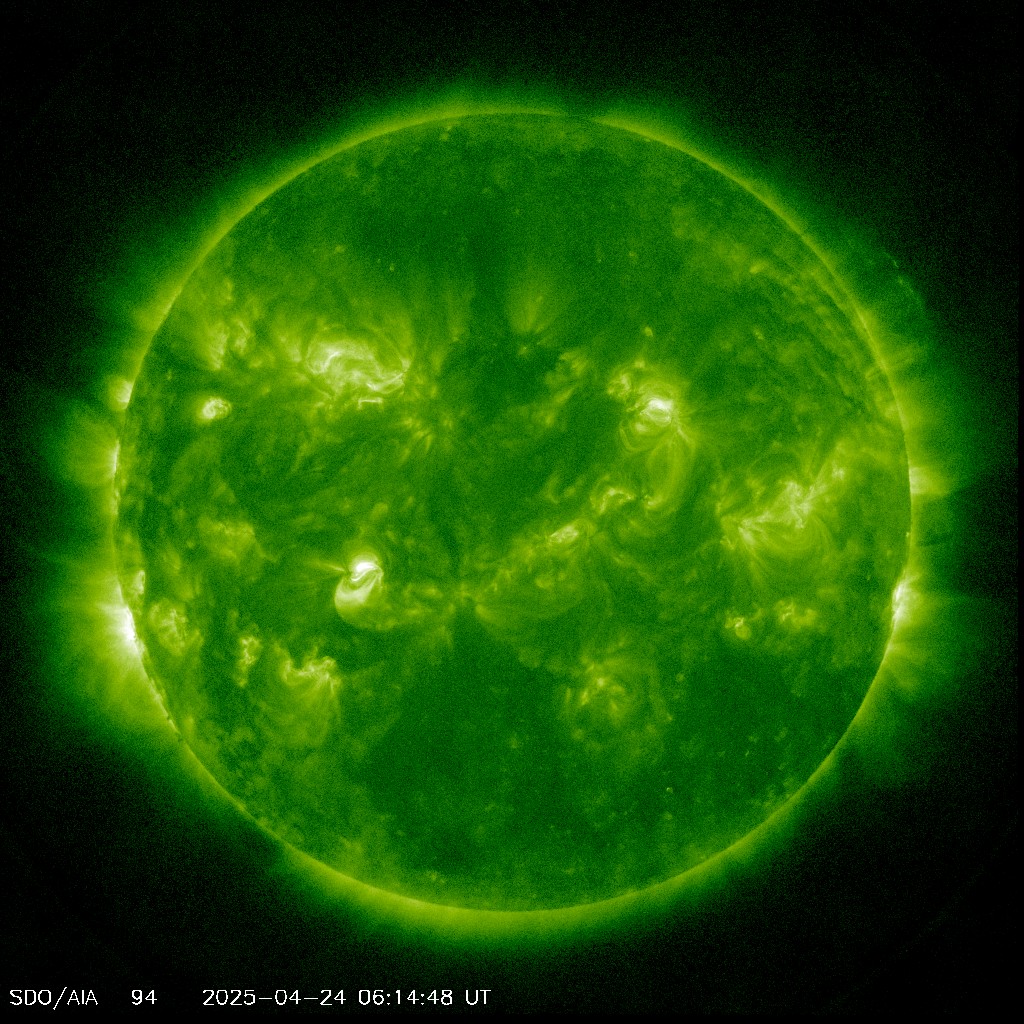
94Å ~6MK
AIA 94Å
Flare plasma (hottest)
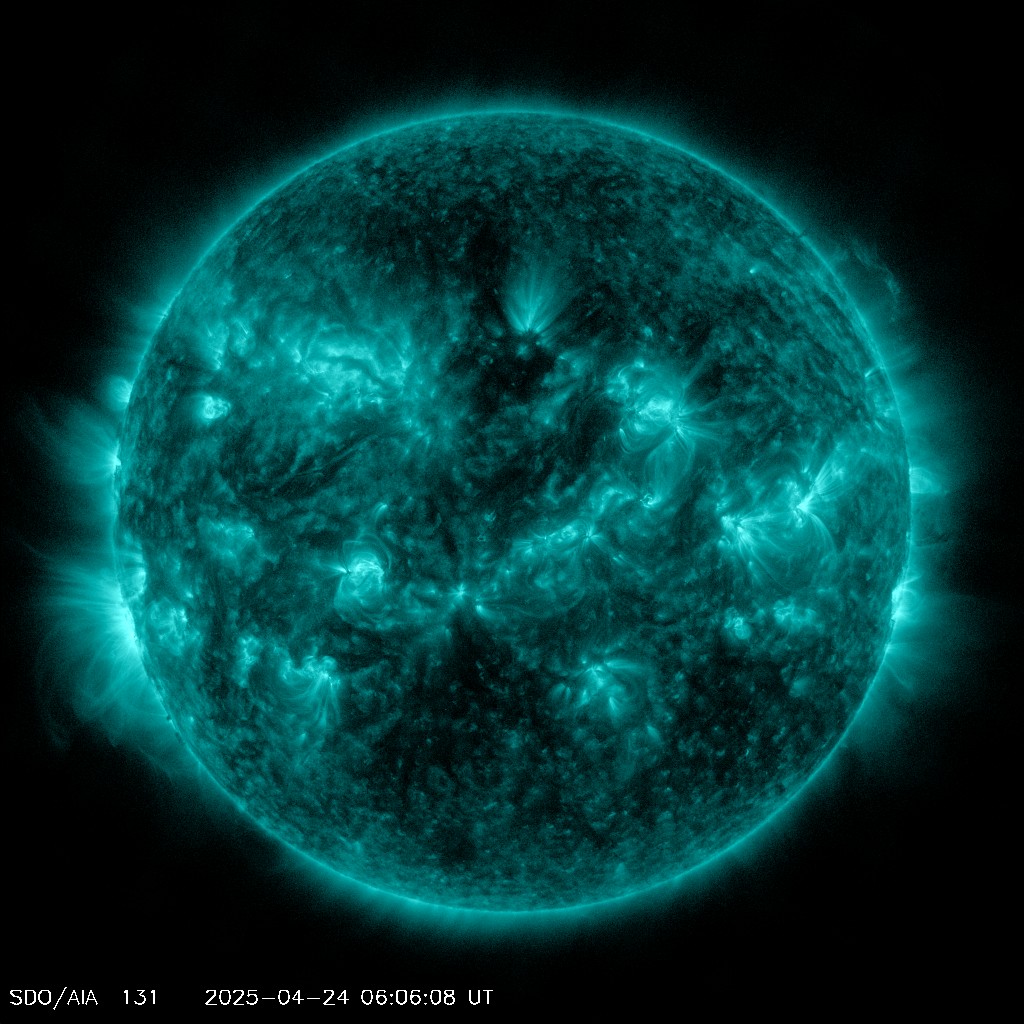
131Å ~10MK
AIA 131Å
Flaring regions
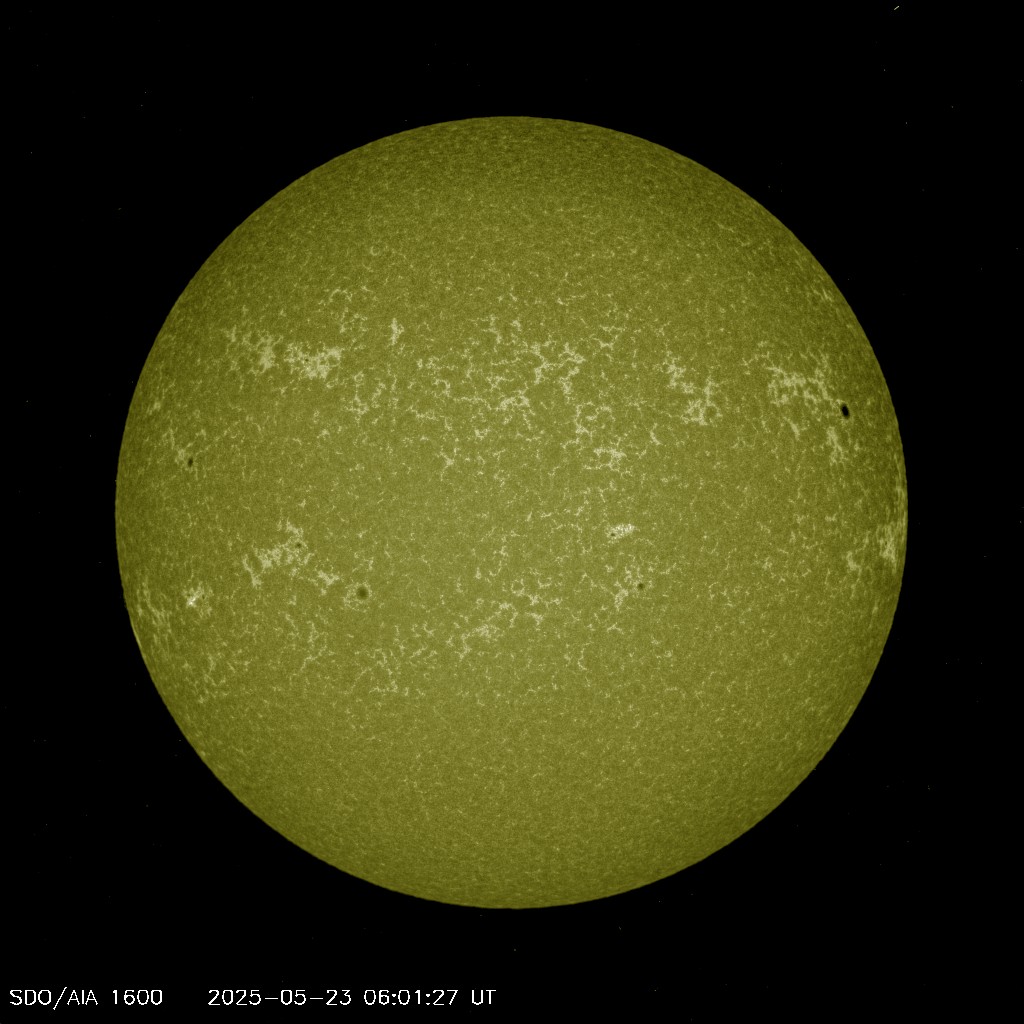
1600Å ~100,000K
AIA 1600Å
Transition region
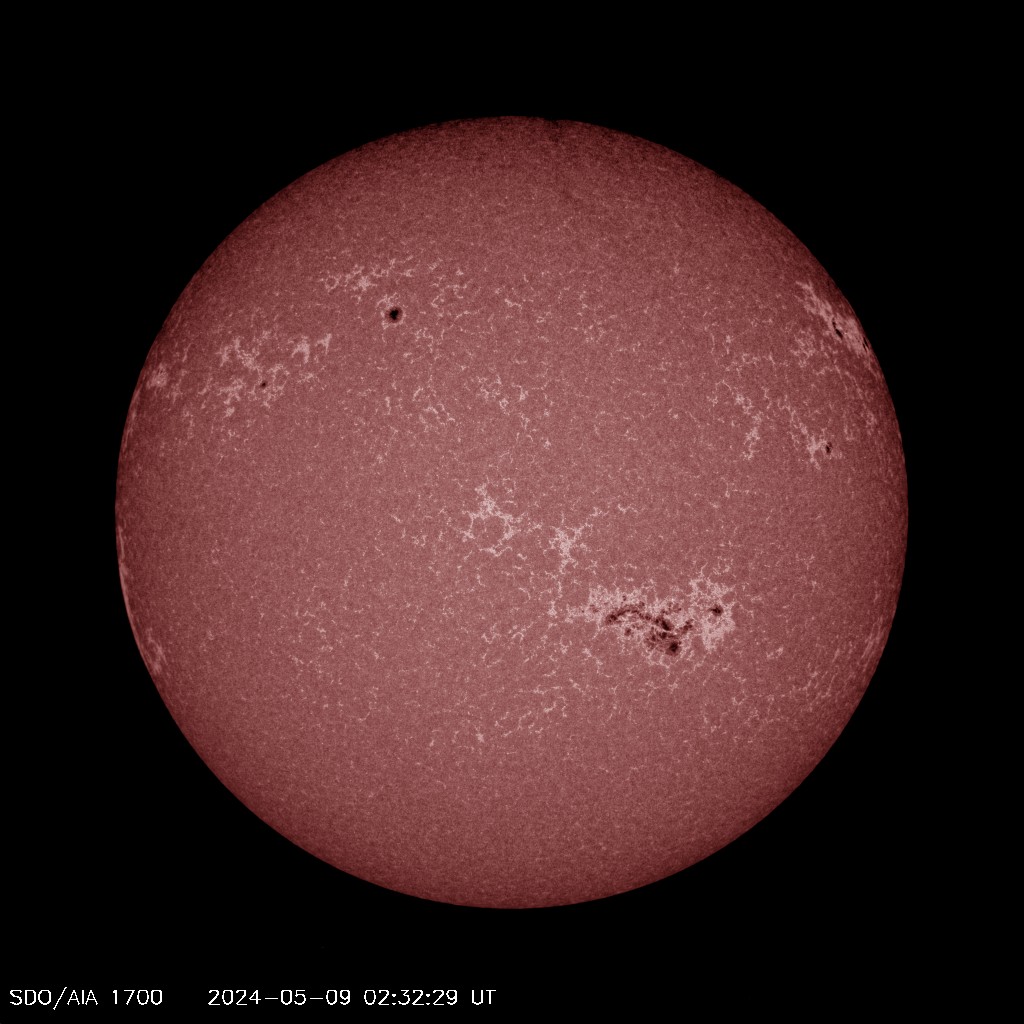
1700Å ~5,000K
AIA 1700Å
Photosphere & sunspots

GOES SUVI

SUVI 94Å
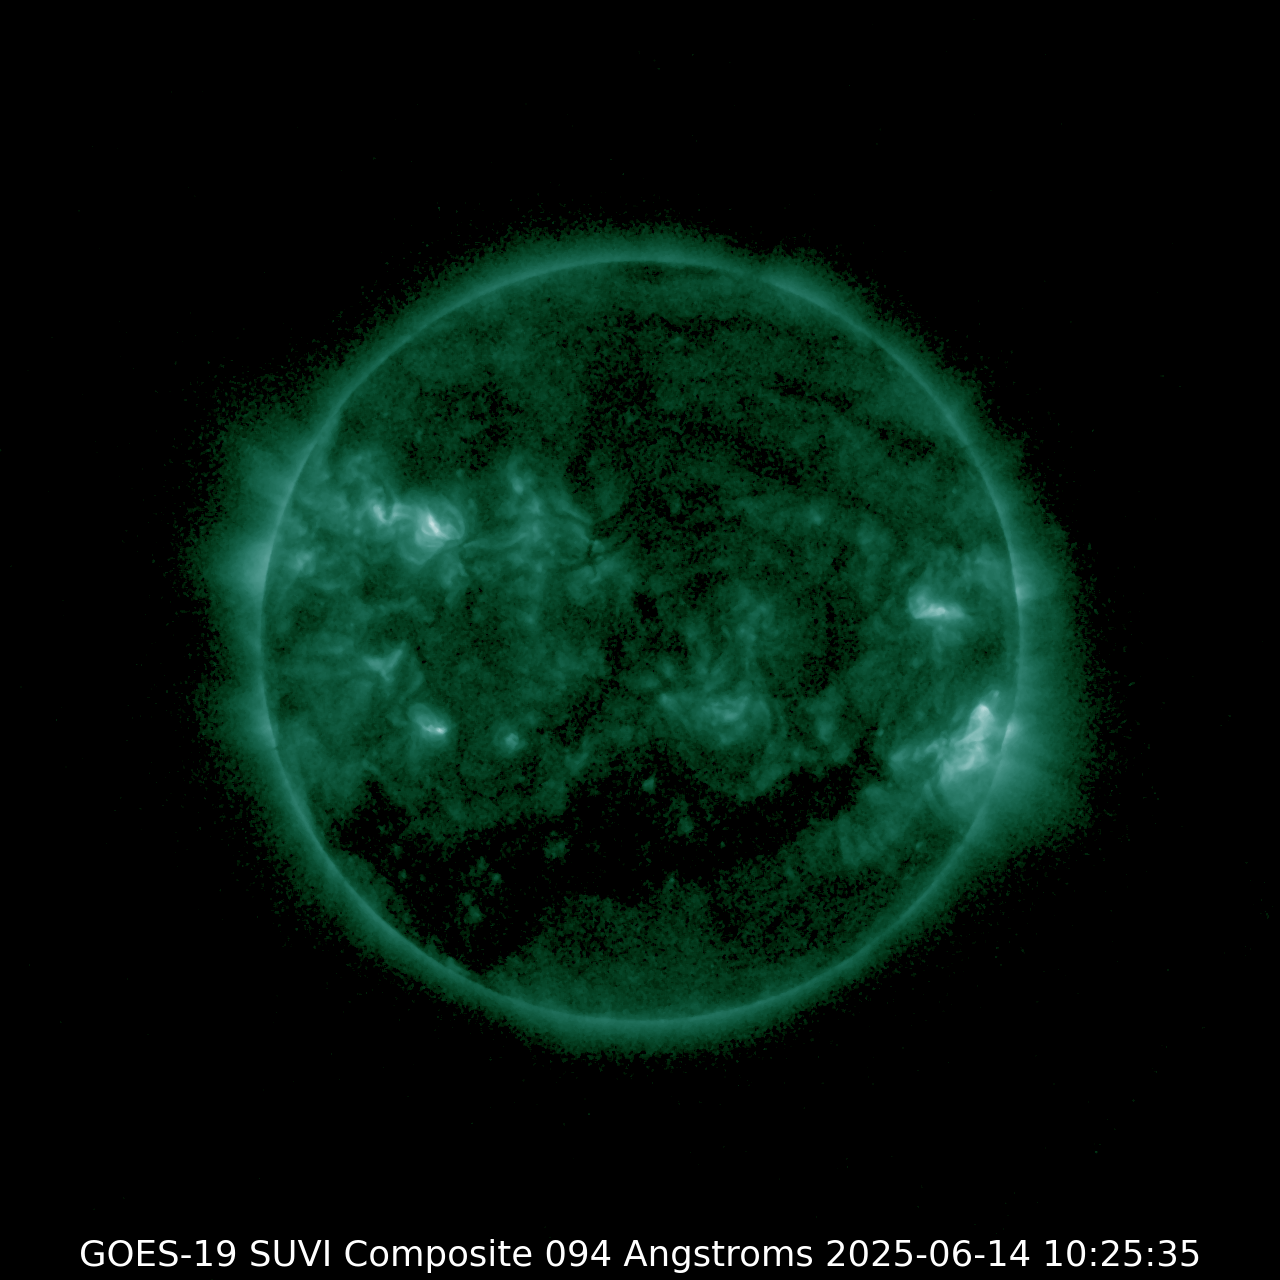
GOES SUVI 94Å
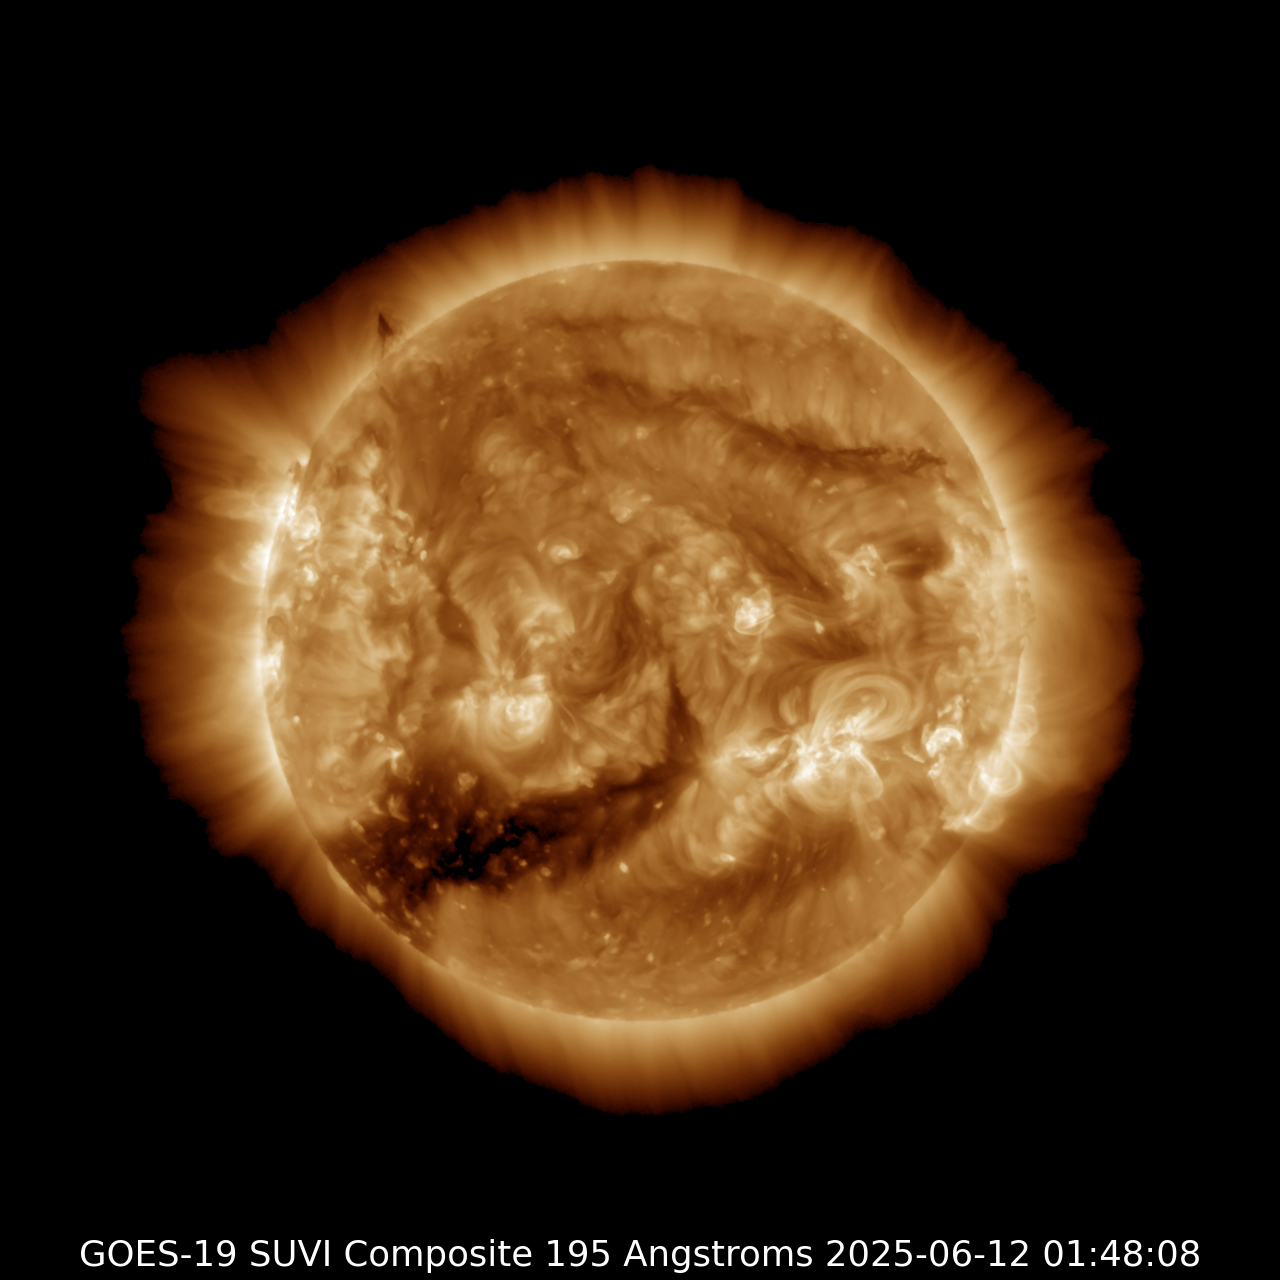
SUVI 195Å
GOES SUVI 195Å
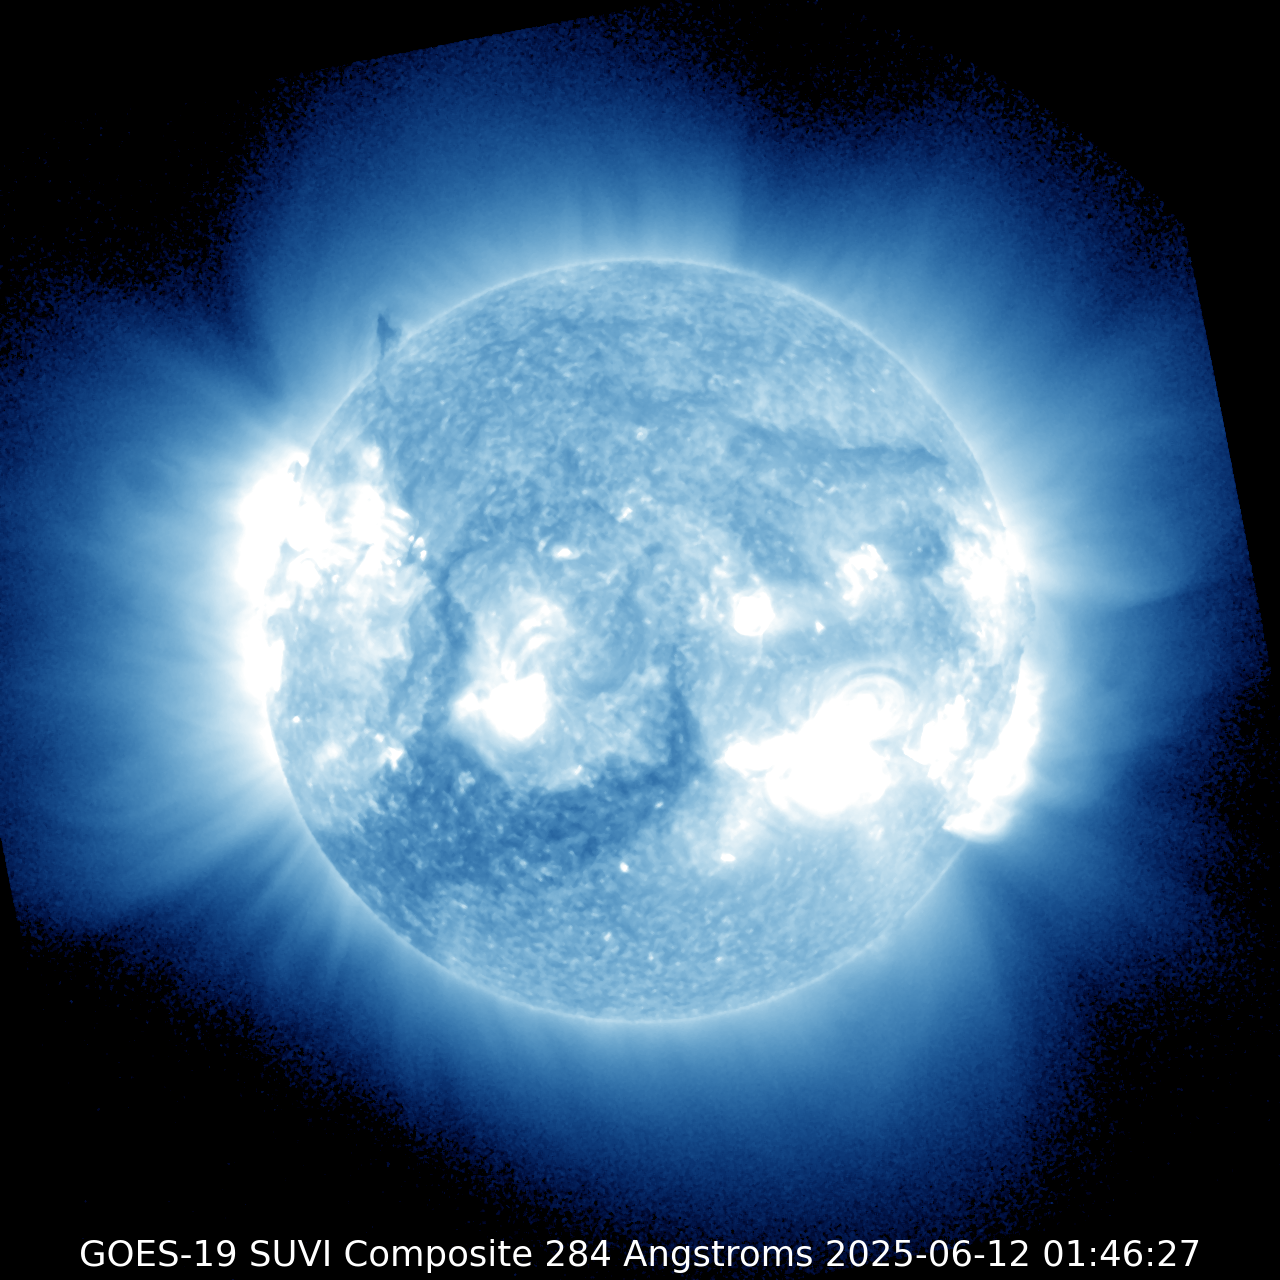
SUVI 284Å
GOES SUVI 284Å
SUVI 131Å
GOES SUVI 131Å
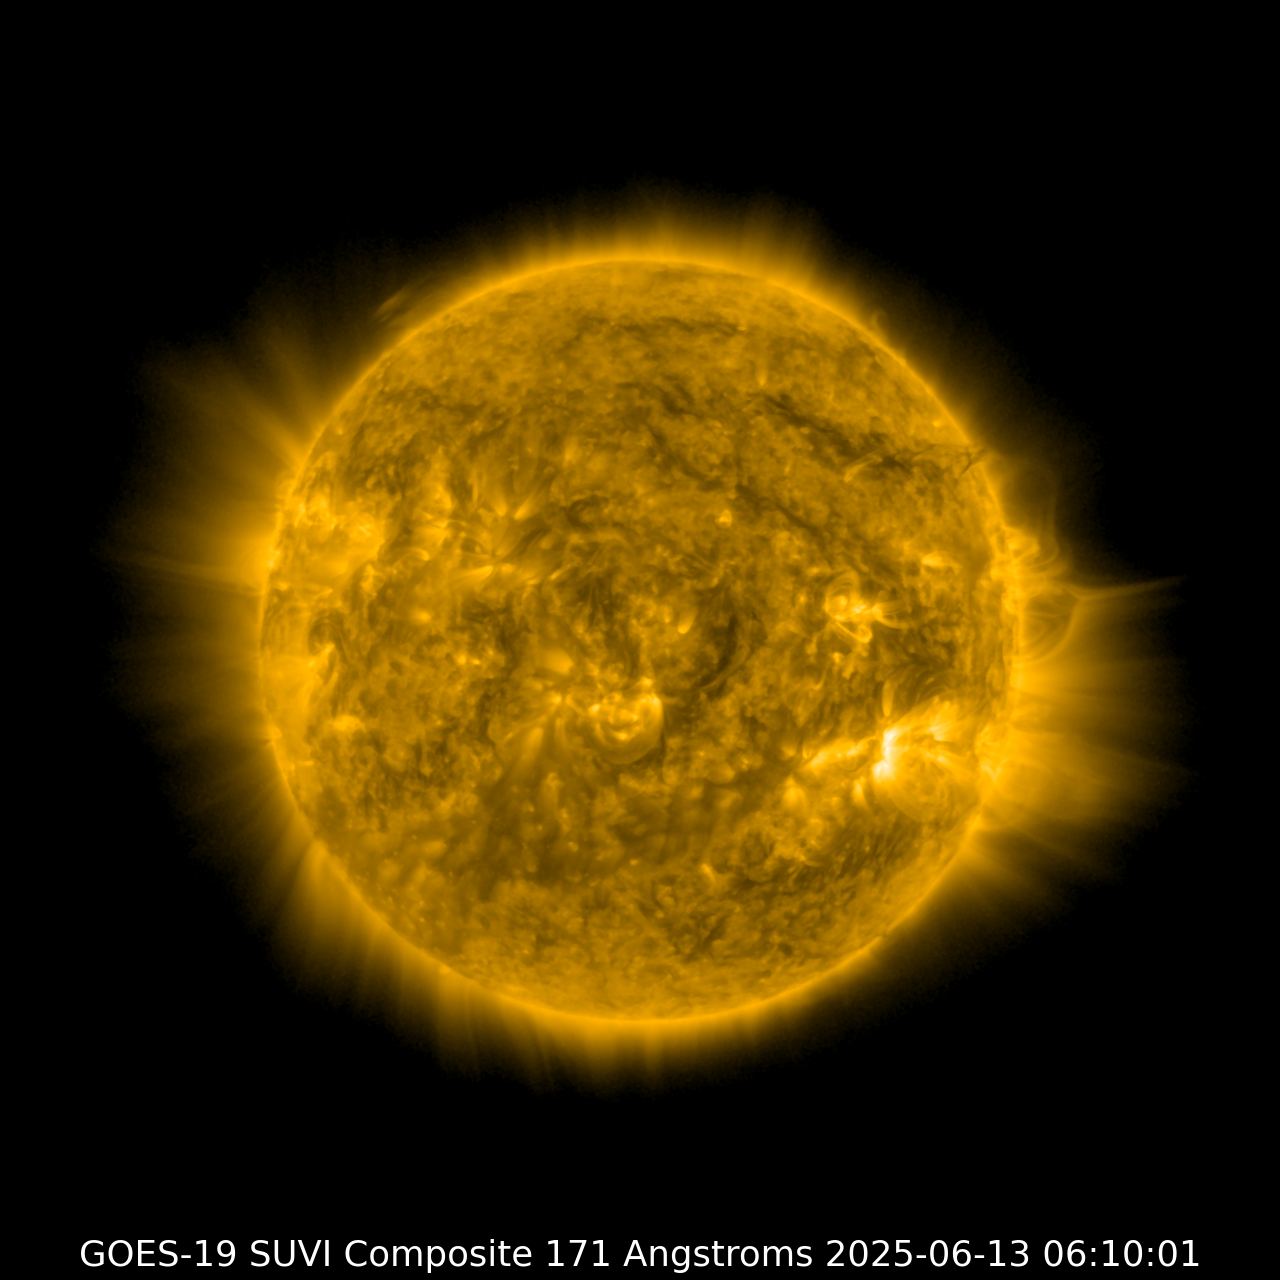
SUVI 171Å
GOES SUVI 171Å
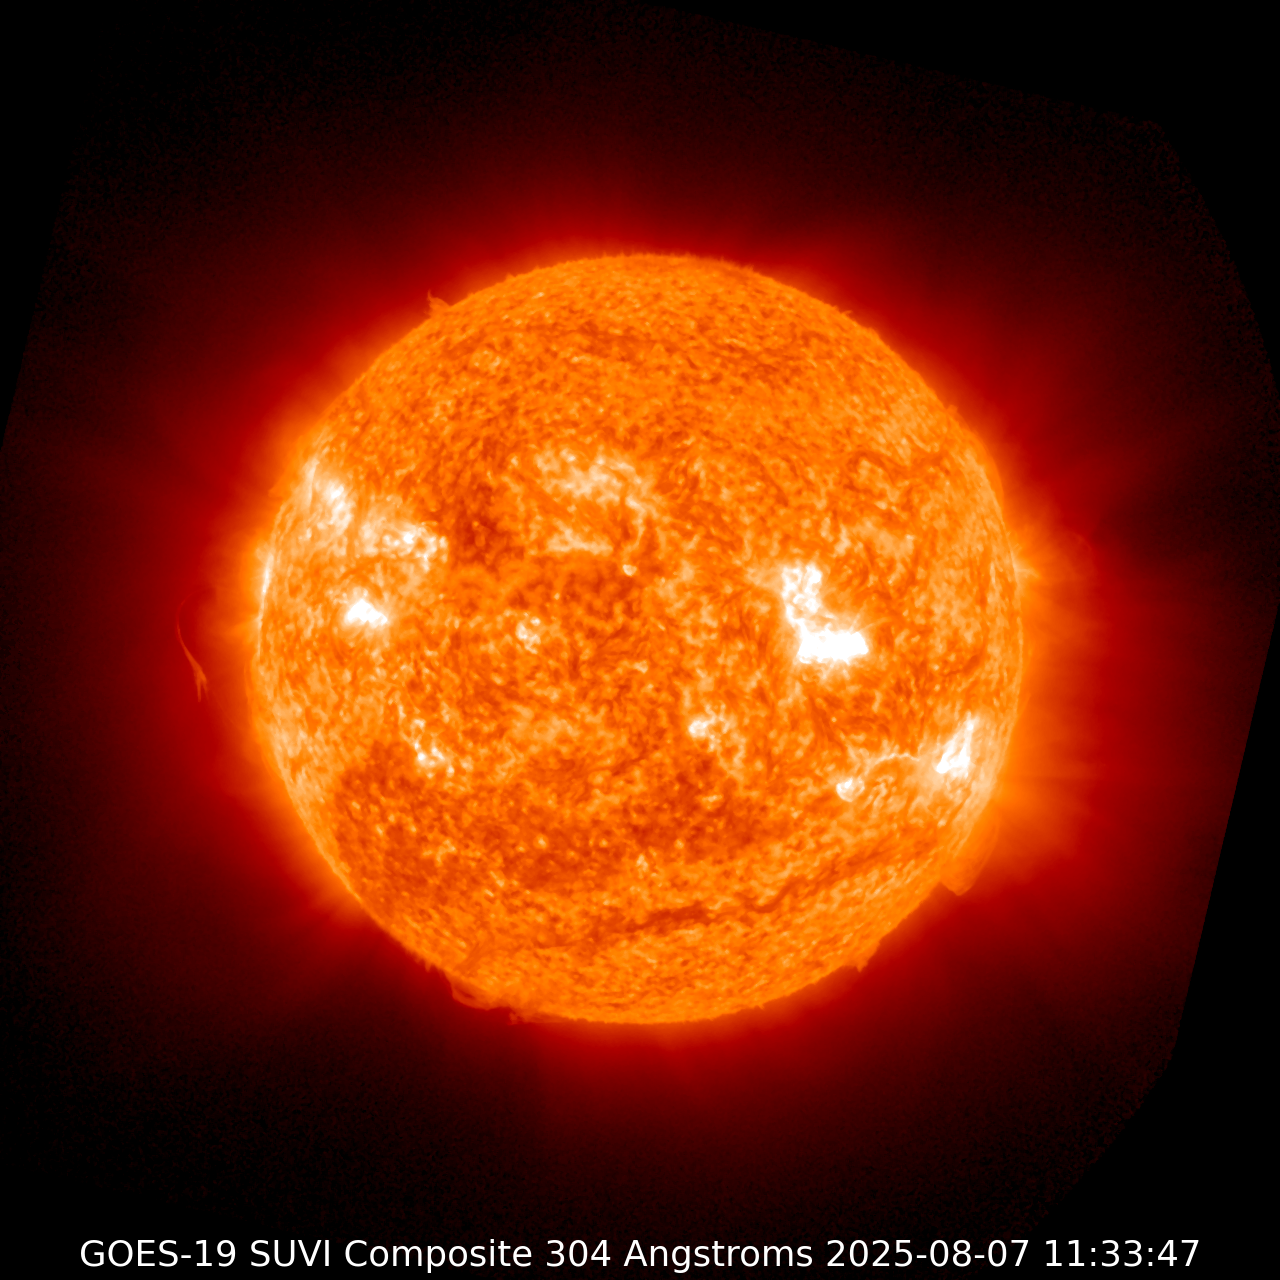
SUVI 304Å
GOES SUVI 304Å
SWPC Report
Loading...
Loading...